Happy (belated) New Year! Along with all the end of 2017 “wrap ups” and 2018 predictions is Swisher’s 2017 Year-End Vacancy Report, released January 6th. Swisher has been doing this analysis for 25 years, and it remains the most comprehensive snapshot of commercial real estate vacancy in Ann Arbor.
As Director of Research for Ann Arbor SPARK, part of my role is to keep track of commercial real estate trends in the region. It’s important for a couple reasons: these trends help us give the best advice to companies looking for space (both local and new to the area), and they are an important component to track for the economic health of our region. This report looks specifically at the Ann Arbor market, which is very different to other areas in the region, but can sometimes predict changes in neighboring areas.
Here are some of my main takeaways and a few of the best visuals from the report. The full report is available here.
My main takeaways:
- Demand for office space in Ann Arbor continues to grow.
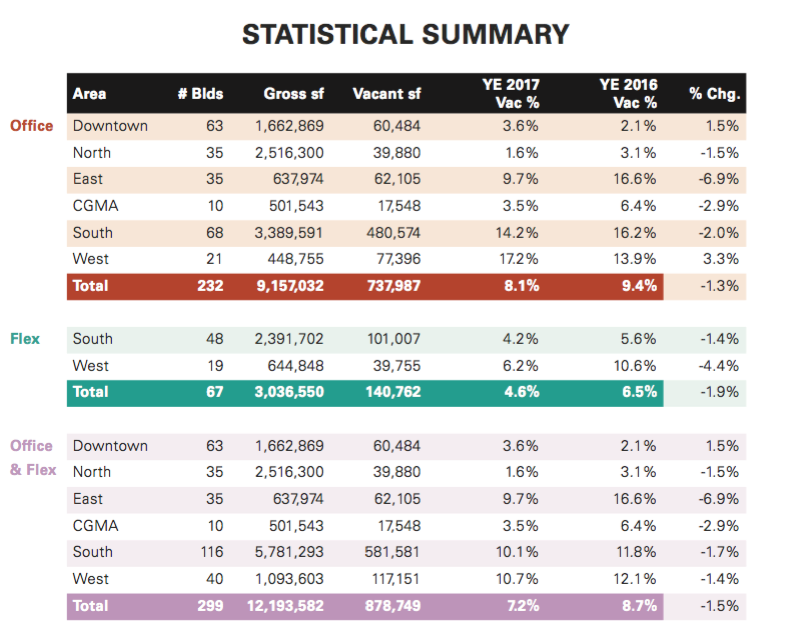
- The market is currently at 92.8% occupancy, up from 91.3% in 2016, and nearly 79% during the Great Recession, continuing an eight year trend of vacancy rate decreases.
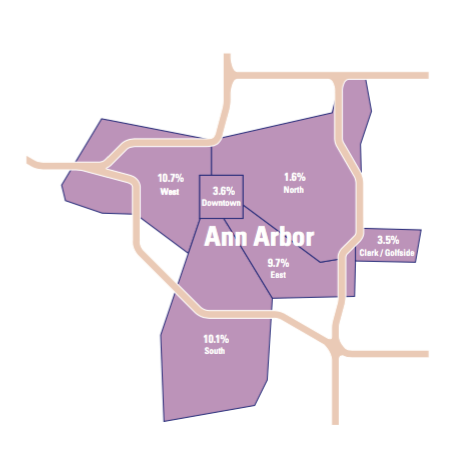
- Demand is highest in Downtown and North Ann Arbor.
- The Downtown vacancy rate is still very low at 3.6%, but slightly higher than 2016 (2.1%), while the North Office Area’s vacancy rate has decreased even further to 1.6%.
- These two areas are the most in-demand and currently command the highest price points. The North Office Area is 2.5 million square feet, with only 40,000 of that currently vacant. The vacancy in Downtown Ann Arbor represents only 26,000 square feet of space.
- Supply and demand is pushing companies to seek more affordable office space.
- The East Office Area saw the most dramatic change, from 16.6% vacancy to 9.7% vacancy. This makes sense as part of the larger supply and demand narrative: as office space in Downtown and North Ann Arbor becomes harder to come by, it gets more expensive, pushing companies to look in other areas. The logical conclusion is that prices will begin to rise even in these historically lower-priced areas.
- West Ann Arbor’s vacancy rate doesn’t tell the whole story.
- The West Office Area vacancy rate increased for the second year, from 13.9% to 17.2%. Most of this vacancy can be accounted for by one 18,000 square foot vacancy. There is ongoing demand for office space in the west part of town, with lots of activity in the 1,000-3,000 square feet range.
- Speculative building projects indicate a high level of confidence that these trends will continue.
- Developers are responding to this eight-year trend of continued vacancy rate decreases; there are a number of speculative projects under construction expected to be completed in 2018. This demonstrates confidence that there will be company expansions, relocations, and new startups to occupy the space.
The picture painted by the report is one of a healthy commercial real estate market in Ann Arbor, indicating a vital, growing economy.
2017 Vacancy Map
Trends

Statistical Summary