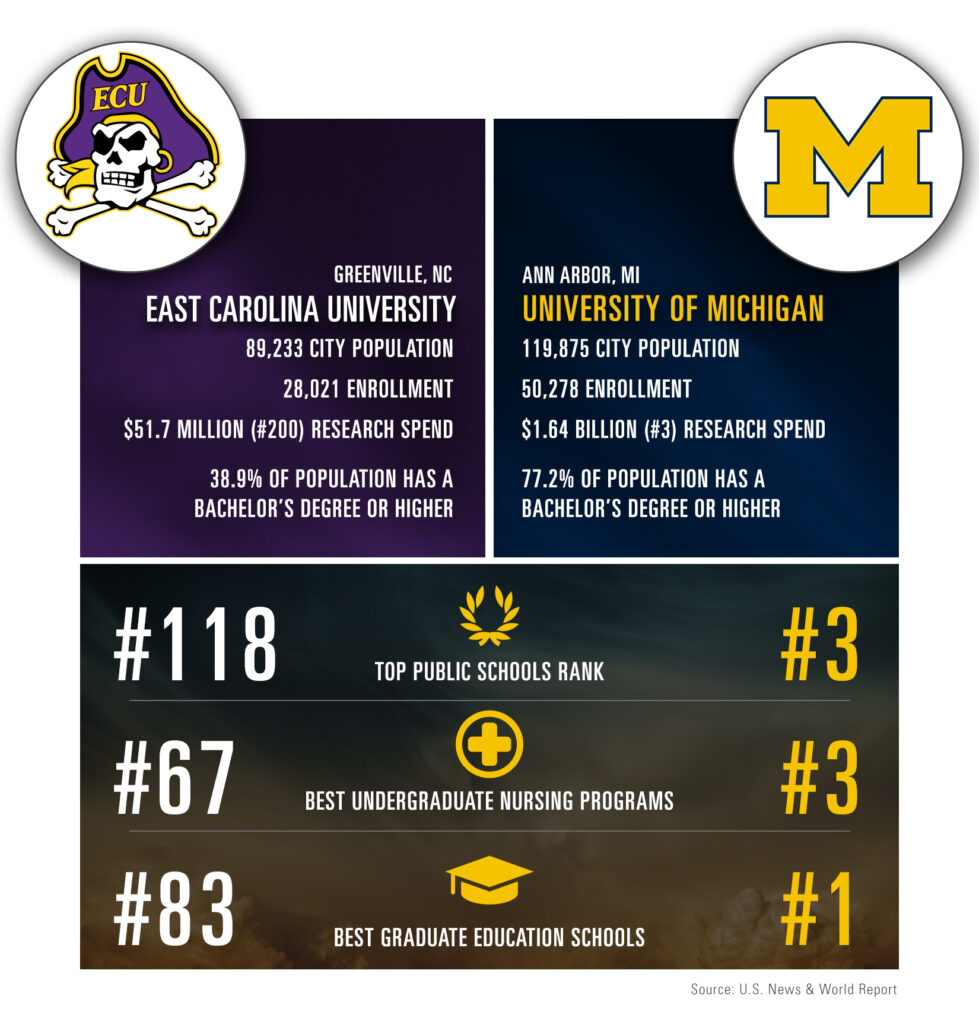
Game 1: Saturday, September 2, 2023 | Michigan vs. East Carolina | Michigan Stadium | Noon EST
Ann Arbor SPARK’s popular football blog series is back for Michigan’s 144th season! We use the football season as an opportunity to compare Ann Arbor to cities around the country represented by our U-M football competition. The question is always – how does Ann Arbor compare to other college towns in the U.S.?
Cooler temperatures are in the forecast and summer is quickly coming to a close as the academic year begins. In a series we look forward to each year, our team uses U-M’s football schedule as an opportunity to compare our region to other college towns represented by U-M’s competition. So, grab your pumpkin spiced latte and settle in as we kick off the football blog series for the 2023-2024 season!
The season opener takes place this weekend with the No. 2 ranked Michigan Wolverines hosting the East Carolina Pirates from Greenville, NC at the Big House for the first time. The Pirates belong to the American Athletic Conference (AAC).
Greenville, the hub of eastern North Carolina, is known for being the place where you can always find yourself in good company. Having a population of around 90,000 residents, Greenville shares a similar scale with Ann Arbor, which has a population of about 120,000. In addition to permanent residents, each city brings tens of thousands of students to their respective regions each year. UM-Ann Arbor had more than 50,000 students enrolled in fall of 2021 while ECU had about half with around 28,000.
Ann Arbor and Greenville both have low unemployment rates (3.9 percent and 4.2 percent, respectively) and both have a 66.8 percent labor force participation rate. The cost of living in Greenville is lower than in Ann Arbor (cost of living index of 93.7 vs 99.9) with the median household incomes being drastically different at $44,064 annually in Greenville and $73,276 annually in Ann Arbor. Likely a large contributor to the gap in median household income between the two regions is the difference in the percentage of the population age 25 or higher with a bachelor’s degree or beyond – nearly 80 percent of Ann Arbor’s population holds a bachelor’s degree or higher while about 40 percent of the population in Greenville have achieved the same.

Be on the lookout for our blog posts ahead of each game all season long and be sure to tag us when you share these interesting tidbits with your friends via social media! And, if you want more information like this or are curious to learn more about the Ann Arbor region and what makes it such a great place to live, work, and locate your business in, please reach out to our Director of Research, Melissa Sheldon. If you’re headed to the game, don’t forget your maize! Go Blue! Wear Maize!
Data Sources
Where do we get our numbers? And what do they mean?
- Population data comes from the U.S. Census, 2022 Population Estimates. Check out Ann Arbor’s data here.
- Enrollment data comes from the Integrated Postsecondary Education Data System (IPEDS). University of Michigan data can be found here.
- Research expenditures data comes from the National Science Foundation View the Rankings by Total R&D Expenditures here.
- Educational attainment data comes from the US Census 2016-2020 American Community Survey Five-Year Estimates. We look specifically at the population over the age of 25, and the highest level attained. Check out Ann Arbor’s data here.
- The rankings come from U.S. News and World Report unless otherwise noted.