Game 7: Saturday, October 15, 2022 | Michigan vs. Penn State | Michigan Stadium | Noon EST
Ann Arbor SPARK’s popular football blog series is back for Michigan’s 143rd season! We use the football season as an opportunity to compare Ann Arbor to cities around the country represented by our U-M football competition. The question is always – how does Ann Arbor compare to other college towns in the U.S.?
This week, the undefeated Wolverines are back home in the Big House to take on the Nittany Lions of Penn State. Michigan and Penn State last met in November last year and the matchup resulted in a win for Michigan (21-17). The two teams have met 25 times since 1993 and Michigan has won 15 of the 25 games (60 percent).
Fun fact #1: State College is commonly known as Happy Valley. The cheerful name originated following the Great Depression, representing the town’s ability to be sheltered from much of the financial hardship experienced by the rest of the country. Now, the term is still relevant since State College is a vibrant college town and is ranked #82 of 100 by Livability.com’s Best Places to Live in the U.S. in 2022 (Ann Arbor is #2 of 100).
Fun fact #2: Penn State’s historic Berkey Creamery has been making delicious ice creams for all to enjoy since the late 1800s. In 1978, Ben Cohen and Jerry Greenfield completed a $5 Penn State Creamery correspondence course in ice cream-making, teaching them the basics of ice cream production. The two alumni took this knowledge back to Vermont and founded Ben & Jerry’s later that same year. Now that’s $5 well spent if you ask us!

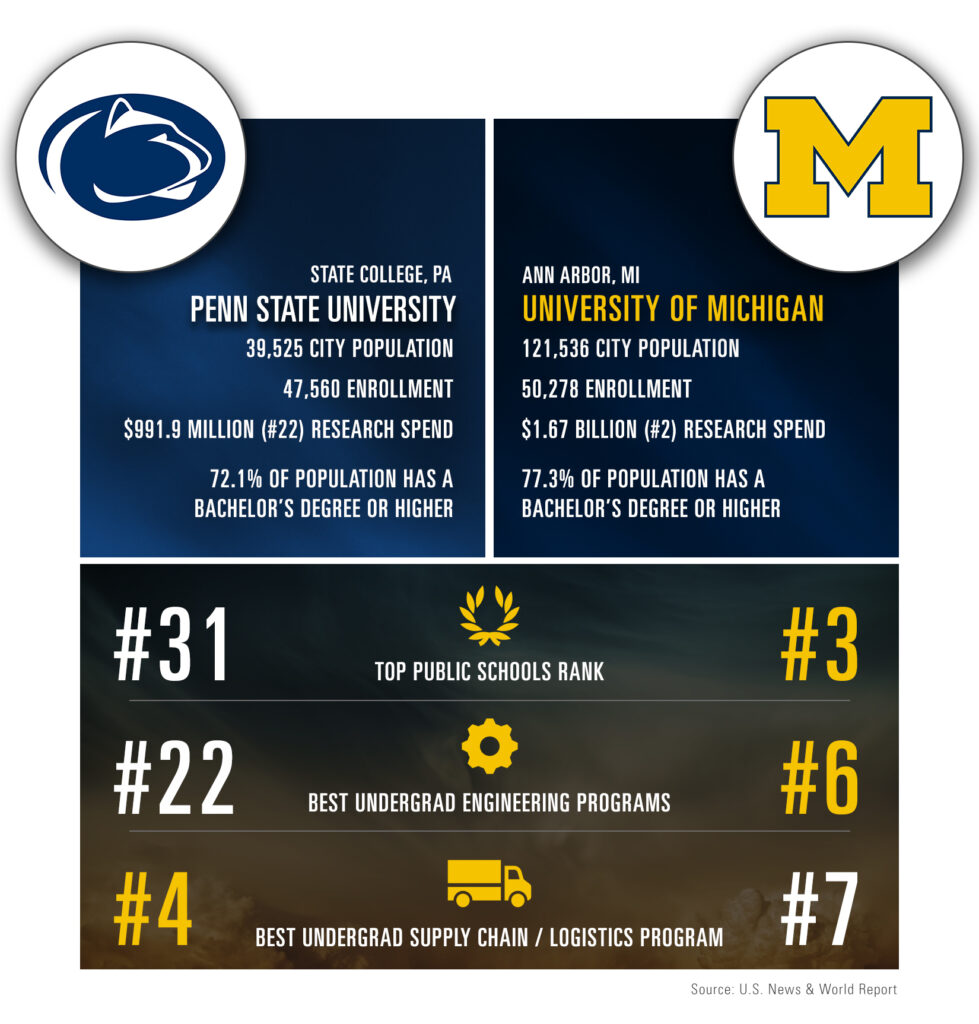
State College is about a third the size of Ann Arbor; however, the combined undergrad and grad student enrollment at Penn State’s University Park campus and Michigan’s Ann Arbor campus are both close to 50,000 students. The cost of living is slightly higher in State College than it is in Ann Arbor, but the median household income is lower. Both areas have a relatively high rate of their population that possess a bachelor’s degree or more (more than 72 percent in each region) and the unemployment rates are very similar with rates of 3.5 percent in the Ann Arbor region and 3.8 percent in the State College area.
Be on the lookout for our blog posts ahead of each game all season long and be sure to tag us when you share these interesting tidbits with your friends via social media! And, if you want more information like this or are curious to learn more about the Ann Arbor region and what makes it such a great place to live, work, and locate your business in, please reach out to our Director of Research, Melissa Sheldon.
In case you missed it, here are links to the regional comparisons we’ve posted so far this year:
- Week 1: Ann Arbor vs. Fort Collins
- Week 2: Ann Arbor vs. Honolulu
- Week 3: Ann Arbor vs. Storrs Mansfield
- Week 4: Ann Arbor vs. College Park
- Week 5: Ann Arbor vs. Iowa City
- Week 6: Ann Arbor vs. Bloomington
Sources
Where do we get our numbers? And what do they mean?
- Population data comes from the U.S. Census, 2021 Population Estimates. Check out Ann Arbor’s data.
- Enrollment data comes from the Integrated Postsecondary Education Data System (IPEDS). Review University of Michigan data.
- Research expenditure data comes from the National Science Foundation. View the Rankings by Total R&D Expenditures.
- Educational attainment data comes from the US Census 2016-2020 American Community Survey Five-Year Estimates. We look specifically at the population over the age of 25, and the highest level attained. Check out Ann Arbor’s data.
- The rankings come from U.S. News and World Report unless otherwise noted.