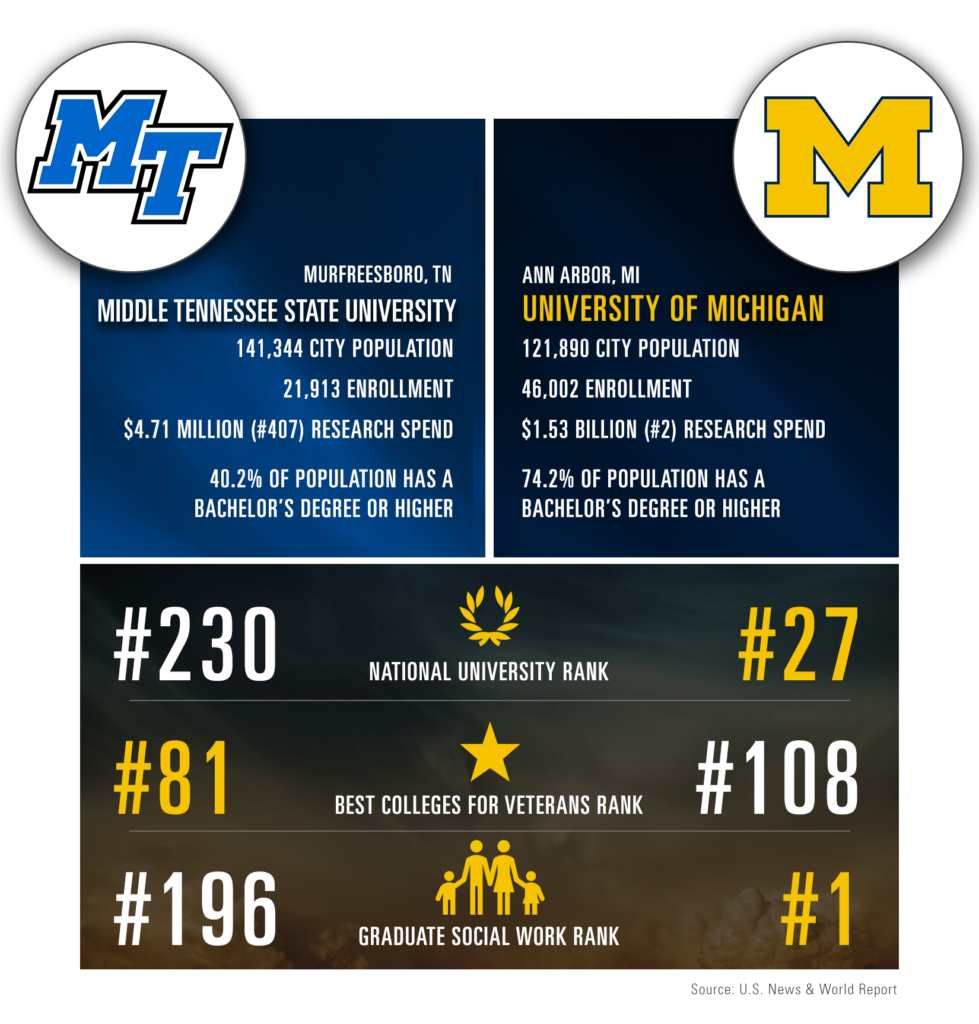
Our football blog series is back for the fourth straight year! We use the football season as an incentive to compare Ann Arbor to cities around the country represented by our U-M football competition. The question is always – how does Ann Arbor compare to other college towns in the US?
It’s the same feeling every year, more energy, a new beginning. The start of the school year in Ann Arbor is always an exciting time. Usually, we have a spate of wonderful weather as the students are moving in while traffic starts to heat up again after the sleepiness of summer. The first football game of the season makes it official: school is back in session.
Yes – you read that right: Murfreesboro. Not a typo, but a town in the middle of Tennessee home to, you guessed it, Middle Tennessee State University. Michigan and Middle Tennessee have never played each other in football – this is an entirely new experience for both teams. While we are used to fewer data points in football, this is an anomaly!
Murfreesboro, TN is 34 miles southeast of Nashville and is actually bigger than Ann Arbor in terms of population (by about 20,000). The University is well-named, as Murfreesboro is both the geographic center and the population center of the state. It is similar to Ann Arbor in that it is also the seat of county government, but the University is hardly its largest employer (in Murfreesboro the largest employer is Nissan).
MTSU is about half the size of U-M and is only ranked in 2 programs by US News and World Report. It is most prominently known for its Recording Industry, Aerospace, Music, and Concrete Industry Management programs. The Rolling Stone College Guide recognized MTSU as having “one of the preeminent music business programs in the country.” The department boasts five recording studios on campus, each open 24 hours a day. (source)

Data Dive
Where do we get our numbers? And what do they mean?
- Population comes from the US Census, 2017 Population Estimates. Check out Ann Arbor’s data here.
- Enrollment comes from each university’s website (what they report on enrollment).
- Research spend comes from the National Science Foundation Rankings by Total R&D Expenditures.
- Educational attainment comes from the US Census 2013-2017 American Community Survey 5-Year Estimates. We look specifically at the population over the age of 25, and the highest level attained. Check out Ann Arbor’s data here.
- The rankings come from US News and World Report unless otherwise mentioned.